
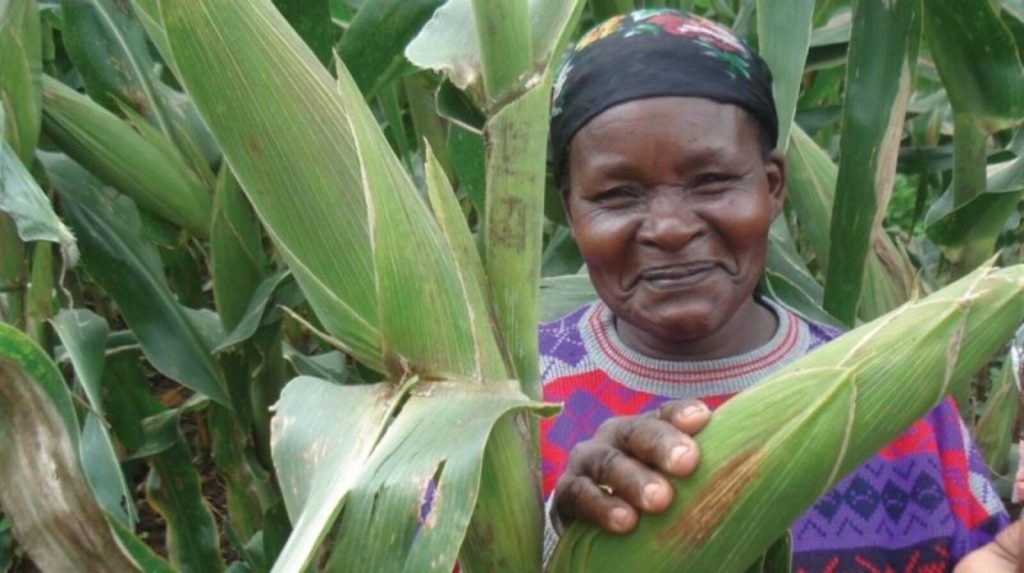
Growing a small farm into an agribusiness in Uganda means changing what you sell and how you price it, not buying more land. Uganda's own national farm survey puts 39 percent of the country's larger scale producers on under two acres. The farms that cross over do it by measuring cost per kilogramme, picking enterprises that actually sell, and closing the gap between harvest and payment.
What Makes a Ugandan Farm a Business Rather Than a Household That Sells Surplus
The dividing line is not acreage and it is not a certificate. It is whether the farm decides what to plant on the basis of what it will earn, and can tell afterwards whether it was right. Almost every Ugandan farm already sells something. Very few can say which of the things they sold paid for itself.
Uganda's Annual Agricultural Survey, run by the Bureau of Statistics with FAO and the World Bank, asks households the main purpose of each enterprise they run. The answers are blunt. Among households growing crops, 0.5 percent grow only for sale. Another 16.7 percent grow mainly for sale with some kept for the home. The remaining four fifths grow mainly or only to eat.
So on the survey's own measure, Ugandan crop production is a subsistence activity with a sideline attached. That is the starting point this page works from, and it is the reason the usual advice lands badly here.
Read that the right way round. It does not say fish farming makes money and maize does not. It says the reason people keep a pond is to sell, and the reason people grow maize is to eat, and those two habits produce completely different farms out of the same land.
Why More Land Is Not How Ugandan Farms Grow
The survey sorts agricultural households into small scale and larger scale producers using FAO's method for the global development indicators. That method is worth a sentence, because the figure it produces looks like a contradiction until you know how it was built. It takes the bottom 40 percent of the combined distribution of three things at once: land operated, livestock held, and the total value of what the farm produced. It is a composite, not an acreage cut off.
On that basis 54 percent of Ugandan agricultural households are small scale producers, ranging from 37 percent in one research zone to 84 percent in another. And here is the figure that should change how you plan.
Thirty nine percent of the larger scale producers operate less than two acres.
A farm can sit in the higher output, higher income group while working under two acres, because it got there on the value of what it produced rather than on the size of what it holds. Meanwhile the average larger scale producer operates 3.1 acres. Three acres is what a big farm looks like in this country. Plans built around mechanised blocks and irrigated fields are aimed at a farm that barely exists in the Ugandan sample.
| Measure | Small scale | Larger scale |
|---|---|---|
| Average land operated | 1.1 acres | 3.1 acres |
| Under two acres | 88 percent | 39 percent |
| Over five acres | 0.1 percent | 14.2 percent |
| Livestock units held | 0.2 | 0.7 |
| Output value a year | 1.1m UGX | 3.3m UGX |
| Share of national output | 28 percent | 72 percent |
| Output per person day | 7,691 UGX | 13,524 UGX |
Divide those columns and the story sharpens. Land roughly 2.8 times larger. Output value about 3 times larger. But output per person day only about 1.8 times larger. The bigger farms are not dramatically better per day worked; they are working more land and more days. Average annual farm income follows the same shape, at 2.6 million UGX for the larger group against under 1 million for the smaller, counting crops and livestock only.
Which means the efficiency prize is smaller than the size prize, and the size prize needs land you probably cannot buy. The land a farm actually needs to start is a separate question with its own arithmetic. For growth, the useful reading is that a quarter acre more will not move you, and a change in what you sell might.
The Enterprise You Pick Decides Whether You Are Farming for Sale
Six of the ranking pages on this search tell farmers to diversify. In Uganda that advice arrives about thirty years late. The survey found 77.5 percent of agricultural households already practising crop production plus other activities, against 21.8 percent growing crops alone and 0.7 percent doing something other than crops. Diversification is already the norm. What is missing is not a second enterprise. It is a second enterprise run to sell.
That is the gap the purpose figures expose. A household can keep goats, a few chickens, bananas and a maize plot and still be running four subsistence activities in parallel. Adding a fifth changes nothing. Turning one of them into something with a buyer, a weight and a price changes everything, and it needs no extra land at all.
Pick that one on evidence rather than on enthusiasm. Two questions do most of the work: does this enterprise have a buyer who pays by weight, and do I know what a kilogramme of it costs me to make? If either answer is no, that is the next job, not the planting.
How Much of Each Crop Ugandan Farmers Actually Sell
The same survey reports, crop by crop, what share of national production was sold unprocessed in each of the two seasons. This table is the most useful thing on the page, because it shows that how commercial a Ugandan farm is depends heavily on what it grows.
| Crop | First season | Second season |
|---|---|---|
| Coffee robusta | 96 percent | 87 percent |
| Coffee arabica | 91 percent | 94 percent |
| Soya beans | 83.3 percent | 80.2 percent |
| Maize | 46.7 percent | 63.4 percent |
| Irish potatoes | 44 percent | 55 percent |
| Beans | 38 percent | 42 percent |
| Groundnuts | 29 percent | 40 percent |
| Cassava | 27 percent | 28 percent |
| Sorghum | 17.6 percent | 24.6 percent |
| Millet | 13 percent | 26.7 percent |
Banana grown for food sits outside that column and is reported differently, at 32 percent sold in both seasons against about 62 percent eaten at home. Two notes before you use any of these. The figures come from one survey round, and the round and the season are what set them, so a different round will print different numbers. And the second season figures run higher partly because fieldwork happened later, when stored stock had already moved.
Still, the spread is far too wide to be noise. A farmer growing millet is running an enterprise the country sells about an eighth of. A farmer growing robusta coffee is running one the country sells nearly all of. Same person, same soil, same effort, and a completely different relationship with a buyer.
The practical use of this table is not to tell you to grow coffee. It is to tell you that if you want to sell more without farming more, you are choosing between crops with structurally different market shares, and the crop you inherited is unlikely to be the one at the top.
Cost Per Kilogramme Is the Figure That Decides What You Grow Bigger
Everything above is background until you can answer one question: what does a kilogramme of your output cost you to produce? Without that number, growing is gambling with more money.
The arithmetic is not hard. Add every shilling that went into one enterprise over one season, including your own labour priced at what you would have been paid elsewhere, then divide by the kilogrammes that came off it. The hard part is the record, which is why the farm record keeping method comes before any of this, and why a sale recorded in basins or unmarked bags cannot become a cost per kilogramme at all. You cannot divide by a basin.
Two things follow immediately once you have it. You can compare your own enterprises against each other, which nobody else can do for you. And you can compare your cost against the gate price and find out whether the enterprise earns on the extra kilogramme or loses on it. The break even calculation is the same sum read backwards, solving for the yield or the price that would put you level.
Records will not get you money. They tell you whether you should be asking for any.
Where Growing Bigger Loses Money on Every Extra Kilogramme
This is the section the ranking pages skip, and it is the reason a growth plan needs the cost figure first. On this site's own costed enterprises, several Ugandan systems break even above the price the farm gate pays. Scale those and you multiply a loss rather than a margin.
Notice what the goat and fish lines do to the usual growth story. On goats, spending more on feed made things worse, so the cheap system won. On fish, the enterprise that every Ugandan household runs to sell is the one where under half the farms surveyed made anything. Most market oriented is not the same as most profitable, and a page that conflated the two would be selling you a pond.
So the honest instruction is narrow. Grow the enterprise where your own measured cost sits below the price you can actually get, and fix or drop the ones where it does not. That decision needs your figures, not these, because yours are the only ones that describe your farm.
Cash Timing: The Farm Constraint That Decides Whether Growth Holds
A farm can have the right crop, a buyer and a margin, and still fail to grow, because the money arrives after the moment it was needed. Ugandan evidence on this is unusually clear and it comes from an unexpected direction.
Field research on a Ugandan oilseed cooperative measured how members actually behaved. They sold outside the group even while the group was reporting a higher price, because the trader paid cash on the day and the society could not. School fees, an illness and a funeral do not wait for a payment cycle. Cash payment was reported by 78 percent of farmers selling to the cooperative, 94 percent selling to a trader and 49 percent selling to the processor's agents, with prices across the three channels within a few percent of each other.
That last line is the whole point. A farm that cannot wait thirty days sells to whoever is standing in the yard, and whoever is standing in the yard sets the price. Building the reserve that lets you wait is a growth investment. It buys no seed and no equipment, which is why it gets skipped. How Ugandan agricultural cooperatives work covers the group side of this, including what the country's cooperative collapse taught about aggregation imposed without liquidity behind it, and farm cash flow covers the projection.
Financing Farm Growth From Margin Rather Than From a Lender
Seven of the ranking pages send the reader to write a business plan and get financing. The Ugandan numbers say plan for that to be a small part of the answer.
Among agricultural households that received any credit at all, here is where it came from.
| Credit source | Share of borrowing farms |
|---|---|
| Self help groups | 48.3 percent |
| SACCOs | 21.1 percent |
| Family and friends | 9.9 percent |
| Micro finance | 7.8 percent |
| Commercial banks | 6.3 percent |
| Money lenders | 2.0 percent |
| Farmer associations | 1.8 percent |
Those are selected sources and a household can use more than one, so the column is not meant to total. The pattern is what matters. Groups and savings societies together account for roughly seven in ten borrowing farms, and commercial banks for about one in sixteen. Group borrowing rose between the two rounds while borrowing through farmer associations fell to under 2 percent.
Size matters more. The average agricultural loan actually received was 548,000 UGX, against 552,000 the round before, ranging from about 182,000 in the lowest research zone to 1.3 million in the highest. Total agricultural credit across the country fell 24.7 percent between the two rounds, from 408 billion to 307 billion shillings. Half a million shillings is real money and it is not a mechanisation plan.
The survey is also candid about why. It records that financial institutions tend to focus on the low risk, high cash flow and well collateralised parts of the chain, leaving higher risk agricultural production underserved. Read that plainly: the constraint is not that farmers keep poor records. Production lending is where the risk sits, and a notebook does not move a farm out of that category. Records let you answer questions about whether you could repay. They are not security, and no page should tell you otherwise. If you do intend to borrow, a farm business plan is how the case gets made.
Which leaves retained margin as the main engine. One enterprise measured, priced and grown by whatever it earned last season is slower than a loan and it is the route the numbers support.
Agro Processing and Value Addition on a Ugandan Farm
Add value and sell processed is the other standard instruction, and it deserves a harder look than it usually gets.
Start with what Uganda declares at its own border. At the detailed commodity codes, Uganda's declared exports of green coffee run around 370 million kilogrammes a year. Its declared exports of roasted coffee, across two separate years, came to 1,652 kilogrammes and 6,470 kilogrammes. That is between four ten thousandths and two thousandths of one percent of declared coffee export weight. In both years the declared partner rows sum exactly to the reported world total, so these are Uganda's own declarations rather than estimates.
On the farm side the survey tells the same story from the other end. Of robusta coffee production, 3 percent in the first season and 12 percent in the second was processed by the producing household. And advisory services reaching farmers on agro processing fell to 12 percent from 15 percent between the two rounds, while advice on production reached 78 percent and advice on prices reached 25 percent.
Two careful conclusions, and not a third. The export route for processed product is close to shut at national scale, so a smallholder plan that assumes an overseas buyer for a processed good is planning against the grain of everything the country actually ships. And the training that would support processing is getting thinner, not thicker. What none of this shows is that processing never pays, because a domestic or regional buyer is a different market from an export container, and this evidence says nothing about that one. If you are weighing it, weigh it against a named local buyer and your own cost per kilogramme, not against the idea that processed always beats raw.
Buyers, Volume and the Farm Record Nobody Collects
Here is a gap worth knowing about before you go looking for a figure that does not exist. Uganda's national survey measures, crop by crop, how much was sold. It records nothing about who bought it.
The survey's description of its three questionnaires lists modules for crop production and disposals, input use, labour, livestock, access to agricultural information, transport, storage, credit, fixed costs, shocks and extension services. There is no module on the buyer. Searching the report itself for farm gate, buyer, trader, middleman, wholesaler and retailer returns nothing, on a text where household, season and percent return hundreds of hits each. The questionnaire itself is not reproduced in the report, so the accurate statement is that the survey's own account of its instruments includes no buyer module, and that is why no national figure for who buys Ugandan smallholder produce exists.
Practically, that means nobody can tell you where your crop should go. You find out locally, one buyer at a time, and you write down what each one paid and how long they took. That record is the one the country does not have and your farm can. Finding produce buyers and setting your own price carry the method.
Volume is the other half. A single farm under two acres rarely holds enough at once to interest a buyer who wants a truckload, which is why aggregation exists and why the payment timing problem above decides whether aggregation survives contact with a member's school fees.
Growing a Farm in Steps You Can Afford to Lose
One number should govern how fast you move. In a single agricultural year, 65 percent of Ugandan agricultural households took a production shock, meaning a sudden loss of crop or livestock output. The round before, it was 74 percent.
Set against that, the sequence almost writes itself.
Slow, and it compounds. The farms in the survey's higher group are not there because of a single leap; they are there because the value of what they produce is higher on land that is often no larger than anyone else's.
Registering a Farm Business and What Changes After That
Registration comes up on three of the ranking pages, usually first. Put it later. A registered name does not change your cost per kilogramme and it does not make a buyer pay faster. What it does do is let you invoice, hold an account in the business name, sign a supply agreement and bid for the kind of contract that requires a registered counterparty. Those all matter once you have volume worth contracting, and none of them matter before.
The practical steps, the bodies involved and what each stage requires sit on how to register an agribusiness in Uganda, which is the page to work from rather than this one. Certification and insurance belong in the same bracket: real requirements for particular buyers, and premature for a farm that has not yet measured a margin on anything. Each has its own page on this site, and neither changes what a kilogramme costs you to produce.
The wider agribusiness hub holds the enterprise specific pages, from an agro shop to a hatchery to a feed business, if the growth step you are weighing is a new venture rather than a bigger version of what you have.
Frequently Asked Questions
How many acres do I need before my farm counts as a business?
There is no threshold, and the national survey is the proof. Thirty nine percent of the households it classes as larger scale producers operate under two acres, and the average one operates 3.1 acres. The classification comes from the combined value of land, livestock and output, so a small holding that produces and sells more sits in the higher group. Work on output value and market orientation rather than on acreage.
Should I expand the crop I already grow, or add a new enterprise?
Neither, until you know your cost per kilogramme on what you already have. After that, the survey's pattern favours making one existing enterprise market oriented over adding a new one, because 77.5 percent of Ugandan agricultural households already run crops plus other activities. You very likely do not need another enterprise. You need one of the current ones to have a buyer and a weight.
What does it actually cost to move from growing food to selling it?
Three things cost money and the rest is habit. A way to weigh what you sell, which is the one real purchase and varies by capacity and type. Something to write in, which is among the cheapest items in any agro shop. And working capital to let you wait for payment, which is the largest of the three and depends entirely on your buyer's cycle. Prices for scales and inputs move with supplier and season, so check the current prices locally rather than budgeting from any figure on a web page.
Can I get a loan to grow my farm?
Possibly, and plan for it to be modest. Among Ugandan agricultural households that borrowed, the average amount received was 548,000 shillings, and about 6 percent of borrowing farms borrowed from a commercial bank while roughly seven in ten used a self help group or a SACCO. Total agricultural credit in the country fell 24.7 percent between the two survey rounds. The survey itself notes that lenders concentrate on well collateralised parts of the chain and that production lending is underserved. Keeping records will not secure a loan, whatever you read elsewhere. It will tell you whether taking one is sensible.
Do I need to register my farm as a business?
Not to start selling, and yes before you can invoice, sign a supply agreement or bid for a contract that requires a registered counterparty. It is a step that unlocks a certain kind of buyer rather than one that improves the farm, so most growers get more from measuring a margin first.
Is agro processing worth it for a small Ugandan farm?
Test it against a named local buyer, because the export evidence is discouraging and the domestic picture is a separate question. Uganda declares roughly 370 million kilogrammes of green coffee exports a year against a few thousand kilogrammes of roasted, and only 3 to 12 percent of robusta production is processed by the growing household. Advisory support for processing has been shrinking. That does not rule it out locally; it does mean the burden of proof sits with your own buyer and your own costing.
How do I tell which of my enterprises is actually making money?
Keep the records separately for each one. A single book covering maize, goats and a poultry flock together can tell you the farm made or lost money and can never tell you which part did it, and the enterprise that looks healthy is often being carried by another. Separating them is the cheapest change available and usually the most surprising.
The one figure worth leaving with is your own. Weigh what comes off one enterprise this season, add up what went into it, and divide. Then check the current gate price for that crop or that animal in your own district, because it moves with season and supply, and see whether the two numbers sit the right way round. If they do, that is the enterprise to grow. If they do not, you have just saved yourself the cost of growing it.