
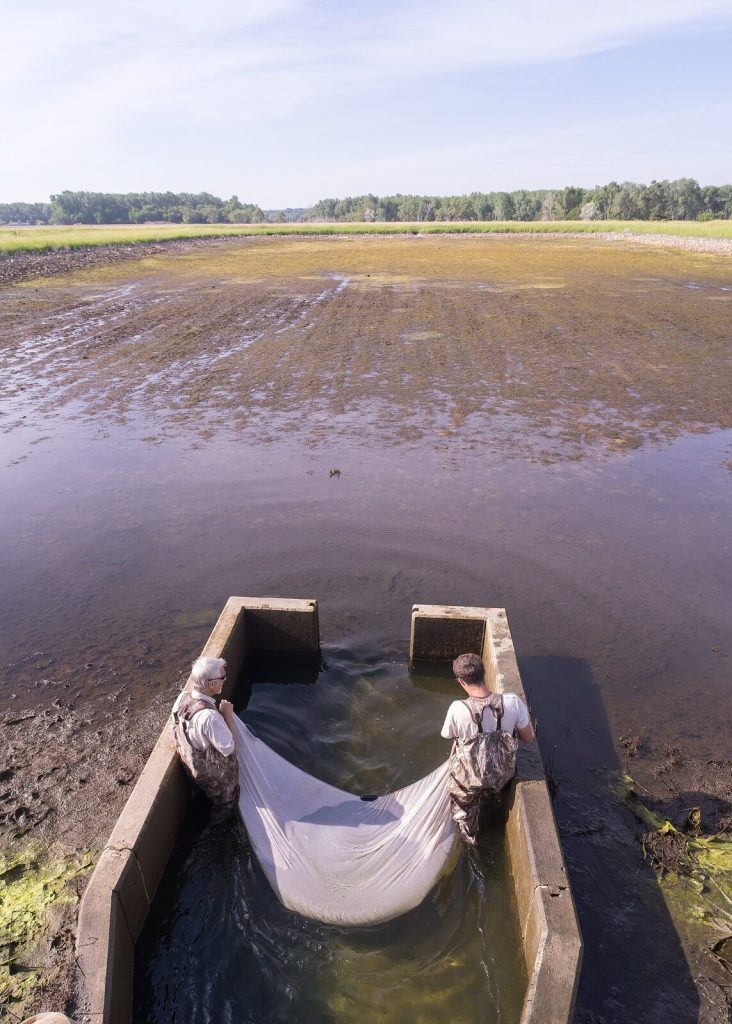
Almost every fish farming profit figure in circulation is built the same way: take the highest stocking density, multiply by the best survival rate anyone has published, then multiply by a retail price. Do that and a small pond appears to produce tens of millions. The calculation below runs in the opposite direction, starting at the kilograms you actually lift out of the water.
How to Calculate Fish Farming Profit: Start at the Harvest
A fish cycle gives you one moment of truth and it arrives at the end. Between stocking and harvest you spend continuously and learn almost nothing, so the calculation has to be built backwards from the harvest rather than forwards from the stocking.
Four numbers carry it. Kilograms harvested, total cost of the cycle, cost per kilogram, and the price per kilogram your buyer pays at the farm gate. Everything else is a way of getting one of those four right.
For what each input line actually costs in Uganda, the companion page on pricing a fish farming budget line by line does the sourcing. This page does the arithmetic. Both pages hang off the farm business hub.
Cost Per Kilogram at Harvest: The Only Figure That Compares to a Market Price
Cost per kilogram is the whole point of the exercise, because it is the only output of a fish budget that can sit next to a price and be judged. Total profit tells you nothing about whether the next cycle will work. Cost per fish tells you nothing, since fish are sold by weight. Yield per square metre tells you nothing about money.
Ugandan farm gate prices give you the benchmark to judge against. Farmed tilapia has sold at the farm gate for 8,000 to 8,200 shillings a kilogram during seasons of heavy wild landings and around 9,000 shillings in months of poor supply, with growers stating they need at least 9,000 to cover production. Western Uganda reporting puts a kilogram of fish at the farm gate between 8,000 and 12,000 shillings, the top of that band reflecting cross border sales.
So the test is simple and brutal. Work out your cost per kilogram. If it lands above 9,000 shillings, you are relying on a good month and a good buyer. Above 12,000 and nothing on the Ugandan price list rescues the cycle. If it lands near 7,000, you have a business.
Survival Rate as a Multiplier on Every Other Fish Farming Cost
Survival is the most powerful number in a fish calculation and it is the one most often written in as an assumption and then forgotten. The figure in Uganda's own extension budget is 90 percent survival at harvest, and a Ugandan cage costing went a point or three higher at 93 percent. Both are targets set by people modelling a well run system. Ugandan nursery guidance expects only 60 to 80 percent survival through the catfish fry to fingerling stage before growout begins.
Survival behaves differently from a normal cost, and the difference is worth stating carefully. If you lose 20 percent of your fish, you lose 20 percent of your kilograms. You do not lose 20 percent of your feed, because those fish ate for months before they died, and you lose none of your fingerling cost, since you already paid for them. So every shilling of cost redistributes onto fewer kilograms, and cost per kilogram rises faster than the loss itself.
Here is that priced out on a 1,000 square metre pond stocked with about 2,300 fish at a 350 gram target, with fingerling and feed costs at current Ugandan prices and feed falling only about half as fast as the harvest does.
| Survival | Harvest, kg | Break even, UGX per kg |
|---|---|---|
| 90 percent | About 725 | About 7,620 |
| 80 percent | About 644 | About 8,140 |
| 70 percent | About 564 | About 8,800 |
| 50 percent | About 403 | About 10,950 |
That is why a survival assumption is not a detail. Ten points of survival is worth more than most of the input price negotiations a farmer spends time on. Stocking properly, screening the inlet, keeping the pond inside its carrying capacity and controlling predators are all survival work, and the stocking density guide is where that starts.
Feed Conversion Ratio and What a Small Change Is Worth in Shillings
Feed conversion is the second lever and it is the one a farmer controls most directly. Ugandan extension guidance uses a ratio of 1.7 in its own pond budget and a Ugandan cage study worked on 1.5 with high quality feed.
One definition point first, because it produces real errors. A feed conversion ratio is feed divided by the gain in biomass, not feed divided by the weight harvested. Those differ, and they differ by more when survival is poor, since feed eaten by fish that died sits in the numerator while their weight never reaches the harvest. Ugandan guidance states a ratio of 1.7 in a budget where 1,360 kg of feed produced 748 kg of fish, which is 1.82 kilograms of feed for each kilogram landed. Both figures are correct and they answer different questions. For a profit calculation, use feed per kilogram harvested, because that is the figure that turns into money.
| Feed per kg landed | Feed cost per kg fish | On 725 kg |
|---|---|---|
| 1.5 kg | 5,700 UGX | 4.13m UGX |
| 1.7 kg | 6,460 UGX | 4.68m UGX |
| 1.82 kg | 6,916 UGX | 5.01m UGX |
| 2.0 kg | 7,600 UGX | 5.51m UGX |
Those figures use feed at 3,800 shillings a kilogram, which is the average reported by Ugandan district fisheries officers. Moving from 1.82 down to 1.5 saves about 1,216 shillings on every kilogram of fish, which is roughly 880,000 shillings on a single 725 kilogram harvest. Nothing else available to a pond farmer pays that well for so little money, and it is the argument for buying a weighing scale and keeping a feeding record rather than feeding by eye.
What pushes a ratio the wrong way is listed plainly in Ugandan guidance: poor quality feed, the wrong pellet size, stressful water conditions, overfeeding, low survival, and continuing to feed for growth when the pond is already at carrying capacity. Feed price is not on that list. The cheapest feed does not give the lowest cost per kilogram of fish, and Ugandan guidance says so directly, which is why a farmer should compare feeds on cost per kilogram of fish produced rather than on price per bag. The feed requirement calculator and the feed requirement figures help with the quantities.
Why Average Harvest Weight Moves Your Price Per Kilogram
Most fish calculations treat harvest weight as a yield input. In Uganda it is also a price input, and a consequence of the pond's own limits makes the arithmetic surprising.
Bigger fish earn more per kilogram. In one Ugandan market, shops charged about 6,000 shillings a kilogram for fish up to 800 grams, 7,000 for fish between 800 grams and 1.1 kg, and 8,000 for fish above 1.1 kg. Kampala wet market prices ran 12,000 shillings a kilogram for small pieces around a kilogram up to 15,000 for fish of 1.3 kg or more. Ugandan market work also found that farm gate prices are set by weight and not by piece, so size shows up in the price per kilogram rather than only in the total.
Now the part that catches people out. A pond has a carrying capacity, put by Ugandan guidance at 0.8 to 1.0 kilograms of tilapia per square metre at one metre average depth on commercial pellets. That caps total biomass no matter what size fish you grow. So growing a bigger fish does not cost you extra total feed, it costs you fingerlings, because you stock fewer of them to reach the same total weight.
Worked through: a 1,000 square metre pond carrying 800 kilograms needs about 2,300 fish at a 350 gram target and about 1,600 fish at a 500 gram target. At 200 shillings a fingerling that is 460,000 shillings against 320,000, so the bigger target is 140,000 shillings cheaper to stock and sells into a higher price band. The costs of going bigger are time and risk: more months of labour, more months of exposure to a water quality failure, and an absolute requirement for monosex stocking, since tilapia mature in ponds at five to six months and a mixed sex pond breeds itself into a crowd of unsellable small fish. Harvest planning is covered in the harvesting guide.
Counting the Feed Eaten by Fish That Died
This is a small section about a line item that almost nobody records and that quietly ruins calculations.
When you total your feed at the end of a cycle, you are totalling feed eaten by two populations: the fish you sold and the fish that died along the way. Only the first group has kilograms in your revenue. If you compute a feed conversion ratio by dividing all your feed by your harvest weight, you get a worse looking ratio than your feed actually delivered, and if you compute it against biomass gain including the dead, you get a better looking ratio than your money experienced.
The resolution is to keep both figures and know which one answers which question. Feed divided by biomass gain tells you how good your feed and your feeding were. Feed divided by kilograms harvested tells you what a kilogram of saleable fish cost you to grow. Use the first to judge the feed, the second to judge the enterprise.
The practical consequence is a record, not a calculation. Note dead fish when you see them, with the date and a rough count. It takes seconds, it lets you place your losses in the cycle rather than discovering them at harvest, and a loss in month two costs far less feed than the same loss in month seven.
Break Even Price Per Kilogram for a Ugandan Fish Pond
Two lines in a Ugandan pond budget cannot be priced from any published source: labour and the working life of the pond. So rather than invent them, calculate the break even price from what can be verified and treat those two as a budget you then have to fit inside.
The verifiable lines are fingerlings and feed. On a 1,000 square metre pond stocked with about 2,300 tilapia plus catfish for population control, at 200 shillings a fingerling and 3,800 shillings a kilogram of feed, and at 90 percent survival, those two lines come to roughly 5,524,000 shillings and produce about 725 kilograms. That is a partial break even of about 7,620 shillings a kilogram.
Set that against the Ugandan farm gate band. At 8,000 shillings, the price paid in months of heavy wild landings, there are about 380 shillings a kilogram left, or roughly 276,000 shillings across the whole cycle, to pay for labour, the pond, harvesting, transport, nets, lime and every small item. At 9,000 shillings there are about 1,380 a kilogram left, or roughly 1,000,000 shillings. Those are the two real answers, and the second one is a business while the first one is not.
Now test it against the one line the calculation left out. On real Ugandan farms, production labour was measured at around 30 percent of total cost, which on this cycle comes to over 2,000,000 shillings. The low price left 276,000. That is the arithmetic behind the Ugandan finding that only 45 percent of 200 surveyed small scale farms reported a profit on their last completed harvest, at an average net return on investment of 0.05 across a six to nine month cycle. Run the division yourself with the break even calculator and the farm profit calculator.
Amortising the Pond: Spreading Capital Over Production Cycles
A pond is not consumed in one cycle, so charging the whole excavation cost against your first harvest destroys that harvest and flatters every one after it. Charging nothing is the more common error and it is worse.
The division is the same one used for any farm asset. Take what the pond cost to build, including the harvest basin, the outlet, the screens and the plumbing. Subtract nothing, because an earth pond has no resale value. Divide by the number of cycles you expect before it needs a major rebuild. Then divide that per cycle charge by your kilograms harvested to get shillings per kilogram.
Do the same for a predator net and a gate valve, which Ugandan reporting prices at up to 300,000 and up to 60,000 shillings a pond respectively, and for harvesting nets, which in the Ugandan survey accounted for 6.9 percent of average cost as purchases plus a further share as rentals.
Two honest points about this. The number of cycles an earth pond lasts in Ugandan conditions before needing desilting or rebuilding could not be sourced for this page, so use your own site's history or a conservative figure and say which you used. And if the pond only pays because you assumed a long life for it, it does not pay.
How Impossible Fish Farming Profit Figures Are Built
Every implausible aquaculture return follows the same recipe, and once you can see the three substitutions you can dismantle any of them in under a minute.
A concrete example is in circulation in Uganda and it is worth converting. One widely repeated account values 2,500 tilapia at 15,000 shillings each, giving 37,500,000 shillings from a 7,750,000 investment. Ugandan reporting elsewhere puts pond tilapia at 400 to 600 grams by the eight month mark, so 15,000 shillings a fish implies 25,000 to 37,500 shillings a kilogram. That is three to four times any verified Ugandan farm gate price for farmed fish. Convert the same 2,500 fish at 500 grams and 8,500 shillings a kilogram and the revenue is about 10,600,000 shillings, before survival is taken off at all.
The habit to build is small. Convert every claim to shillings per kilogram at the farm gate before you believe it, and ask what survival rate it assumed. Most claims do not survive either question.
Worked Calculation: A Fed Tilapia Pond at Current Ugandan Feed Prices
Assumptions, all stated. A 1,000 square metre pond at one metre average depth, carrying capacity 800 kilograms, monosex tilapia stocked at about 2,300 with catfish added at roughly 10 percent of that number for population control, target harvest weight 350 grams, survival 90 percent, feed per kilogram landed of 1.82, feed at 3,800 shillings a kilogram, tilapia fingerlings at 200 shillings and catfish fingerlings at 225.
Kilograms harvested: 2,300 multiplied by 0.90 multiplied by 0.35 kilograms gives about 725 kilograms.
Feed: 725 multiplied by 1.82 gives about 1,320 kilograms, costing about 5,016,000 shillings.
Seed: 2,300 tilapia at 200 plus about 230 catfish at 225 gives about 512,000 shillings.
Verifiable cost total: about 5,528,000 shillings. Cost per kilogram: about 7,625 shillings.
Revenue at 8,000 shillings a kilogram: about 5,800,000, leaving about 272,000 shillings. Revenue at 9,000: about 6,525,000, leaving about 997,000 shillings. Neither figure carries labour, a pond charge, harvesting or transport, and Ugandan survey evidence suggests the labour line on its own swallows the smaller of the two.
The verdict on this pond is not a number, it is a condition. It works at the top of the Ugandan price band with good survival and sinking pellets, and it does not work at the bottom of the band. A farmer who can choose the month of harvest has a business and a farmer who harvests when the money runs out does not.
Worked Calculation: An Underfed Pond, and What the Cost Structure Reveals
Now a second scenario the first one cannot tell you about, and the more common one in Uganda. The same pond, fed on maize bran rather than pellets, which is what 47 percent of farmers in a survey of 200 central Ugandan farms were doing, against 24 percent using manufactured feed.
Bran is cheaper per kilogram and much poorer in protein, so two things happen at once. Feed conversion worsens, meaning more kilograms of feed per kilogram of fish. And growth slows, so at harvest the fish are smaller, which drops them into a lower price band per kilogram. The farmer saves cash and loses margin.
The diagnostic is in the cost structure, and this is the most useful test on the page. In a properly fed pond, feed dominates: Uganda's extension budget shows feed swallowing 91 percent of variable cost, and the Ugandan cage costing puts it above three quarters of total cost. In the 200 farm Ugandan survey, feed was 24.8 percent of cost, seed was 29.8 percent and production labour 29.8 percent.
So total your own costs and look at the shares. If feed is a small fraction of your cost, your pond is not efficient, it is underfed, and the survey tells you what that produces: an average smallest table fish under 500 grams, fewer than half of farms making a profit, and a net return on investment of 0.05 over most of a year. The fix is not cheaper feed. It is feeding a complete diet to a stocking rate the pond can carry, which usually means stocking fewer fish and feeding them properly.
Cycle Length and Cash Flow Between Fish Harvests
A stocked pond is a single concentrated bet, and the calendar of that bet matters as much as its arithmetic.
Ugandan cycles run six to nine months on most surveyed central farms and eight to ten months in western reporting. Across that whole stretch, money goes out weekly for feed and comes in once, at the end. Over 90 percent of farms in the Ugandan survey financed production from personal funds, which is the natural response to a cash pattern no lender likes.
Three consequences belong in the calculation rather than in a footnote. A cycle that runs out of feed money in month six does not produce a smaller harvest proportionally, it produces small fish that drop a price band, so the last two months of feed are the most valuable ones in the cycle. A harvest that lands in a month of heavy wild landings meets the 8,000 shilling price rather than the 9,000 shilling price, and the Ugandan seasonal pattern is known well enough to plan around, with the heaviest landings during the strong rains from September to December and the lowest around June and July. And one pond means one payment a year or so, while several smaller ponds sized to what your market absorbs each week let you harvest and sell continuously, which is exactly the cash flow comparison Ugandan extension guidance sets out.
Work the cash timeline before stocking, not after. The farm cash flow explainer covers the mechanics, and finding a buyer before you stock is what makes harvest timing a choice rather than an accident.
Stress Testing the Calculation Against Feed Price and Fish Price
One calculation at one set of prices is a guess with decimal places. Two prices move enough in Uganda to flip the answer, so test both ends of each.
Feed runs roughly 3,500 to 5,000 shillings a kilogram, the top of that being imported floating feed. Farmed tilapia runs roughly 8,000 to 9,000 at the farm gate in most reporting, with 12,000 achievable in western districts including sales across the border.
| Feed price | Break even, UGX per kg | At 8,000 a kg |
|---|---|---|
| 3,500 per kg | About 7,075 | Workable |
| 3,800 per kg | About 7,625 | Very tight |
| 4,400 per kg | About 8,715 | Loss |
| 5,000 per kg | About 9,805 | Heavy loss |
Two readings from that table. The first is that the feed price alone decides the outcome at a fixed fish price, which is why a written feed quote per kilogram is the first document to obtain before digging anything. The second is that a system requiring imported floating feed cannot break even at the ordinary Ugandan farm gate price on these assumptions, which is a finding about system choice rather than about farming skill.
Then stress the third variable, which the table holds still. Combine a high feed price with survival at 70 percent and break even moves past 10,000 shillings a kilogram. That combination is not unlucky, it is what a water quality failure plus an imported feed bill looks like, and a calculation that has never been run at those values will not warn you.
Farm Records That Make a Fish Profit Calculation Possible
None of this works from memory, and a pond gives you no daily feedback to remember. Five records carry the whole calculation, and only 48 percent of farms in the Ugandan survey kept written records of any kind.
Stocking record: date, species, number stocked, size or weight at stocking, and where the fingerlings came from. Stocked biomass is needed for any honest feed conversion figure.
Feeding record: kilograms given, by date, and which feed. This is the numerator of your feed conversion ratio and the largest line in your budget, and feeding by eye makes it unknowable.
Sampling record: weigh a small sample every few weeks and note the average weight. This is what lets you adjust feeding to the fish you actually have, and it turns a harvest from a surprise into a forecast.
Mortality record: date and rough count whenever you see dead fish. Without this your survival rate is a guess made at harvest.
Harvest and sales record: total kilograms, total number, average weight, price per kilogram received, and the date. Price per kilogram rather than price per piece, since that is how farm gate sales are set and how the calculation works. Tools that help: the farm expense template and the fingerling price page for your seed line.
Fish Farming Profit Calculation: Questions Farmers Ask
What survival rate should I use if I have never harvested before? Not 90 percent. That is the figure in worked templates, not an observation from a typical Ugandan pond. Run your first calculation at 70 and 80 percent and see whether it still works, then use your own measured figure from cycle two onwards. If the plan only works at 90 percent, it does not work.
Is fish farming more profitable than poultry or dairy? It converts feed better than either, which is a genuine advantage, and it carries a worse cash pattern, since everything is spent before anything is earned. Fish concentrates the risk too. Birds die one at a time and a pond goes all at once, overnight. The comparison that matters is your own cost per kilogram against the price your buyer pays, not a general claim about the enterprise.
Why is my harvest smaller than the number I stocked multiplied by my target weight? Two reasons and usually both. Survival, which you did not record and have been assuming was high. And average weight, because fish only reach the target weight if they were fed a complete diet to a stocking rate the pond could carry. The second one is why an underfed pond gives a small harvest of small fish rather than a smaller number of proper fish.
Should I feed more to grow bigger fish? Up to the pond's carrying capacity, yes. Beyond it, no, and Ugandan guidance names continuing to feed for growth at carrying capacity as one of the things that wrecks a feed conversion ratio. There is also a hard ceiling on feed input in a fertilised pond without aeration, put at 10 grams per square metre a day, because the water cannot process more waste than that.
How do I value my own labour in the calculation? At what you would pay someone else. Ugandan survey data puts production labour at about 30 percent of total cost on real fish farms, while the government's own worked pond budget enters labour as zero. Copying that zero is how a losing pond appears to make money.
Can I calculate profit before I harvest? You can forecast it, and that is the point of sampling. Average sample weight multiplied by your estimated surviving numbers gives you a projected harvest, which you can price against this month's farm gate figure and compare to what you have already spent. Doing that in month five is what lets you decide whether to buy two more months of feed or to harvest now.
Does a bigger pond give a better answer? Not on its own. Pond area sets carrying capacity, carrying capacity sets the feed bill, and the feed bill is the largest line in a properly run cycle. A bigger pond you cannot afford to feed produces the small fish and thin margin the Ugandan survey measured. Size the water to the feed you can buy, not the other way round.
Should I harvest the whole pond at once? That is a cash flow question rather than a biological one. One complete harvest gives one payment and forces you to sell into whatever the market is doing that month. Ugandan extension guidance sets out the alternative of several smaller ponds sized to what your buyer absorbs each week, which lets you harvest and sell continuously.
What single change improves the answer most? On these numbers, feed conversion. Moving from 1.82 to 1.5 kilograms of feed per kilogram of fish is worth about 1,216 shillings on every kilogram, roughly 880,000 shillings on a 725 kilogram harvest, and it costs the price of a weighing scale and the discipline to write down what you fed.
Before you trust any of this on your own pond, get three figures that are yours rather than mine: a written feed price per kilogram from a supplier you can actually reach, a fingerling price and booking lead time from a producer near you, and last month's farm gate price per kilogram from the buyer you intend to sell to. Put those three into the five divisions at the top of this page. A cost per kilogram built from your own quotes is the only one that can tell you whether to stock, to wait, or to build a smaller pond.